Management TUI
Run in a Linux terminal or SSH session. The TUI ships in the executable and opens no management port. It is read-only by default; mutations require --control, existing OS permissions, and explicit confirmation.
sudo netflowscout tui --endpoint-dir /etc/netflowscout/endpoints
sudo netflowscout tui --endpoint-config /etc/netflowscout/endpoints/billing.json --control
ssh -t host 'sudo netflowscout tui --endpoint-dir /etc/netflowscout/endpoints'
Screenshots
These captures show the actual bilingual TUI running in OrbStack Linux/arm64 at 120×36. They are rendered from real PTY output with the purple theme preserved. Click an image for its original size. Services, PIDs, counters and memory are example values from the capture session; press L to switch interface language.
Overview: inspect each stage separately
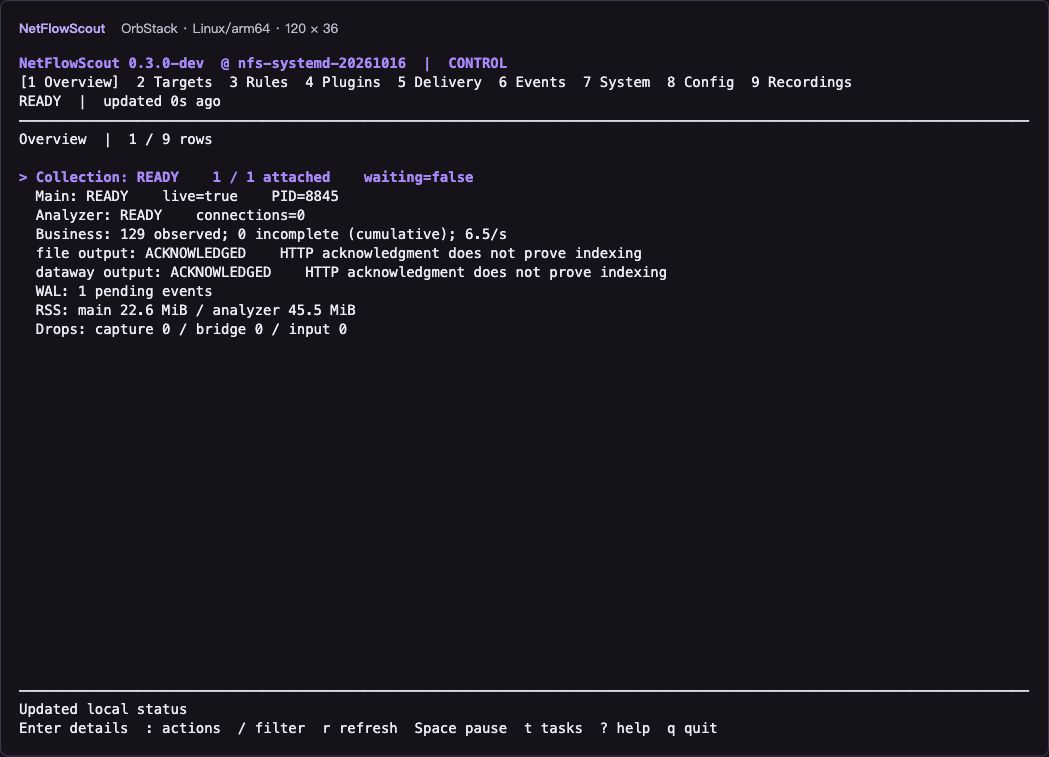
Press 1 to inspect coverage, business records, delivery evidence, WAL and resource usage. Process readiness and output acknowledgments remain separate so that a running service cannot imply a working business pipeline.
Choose an application: search and select
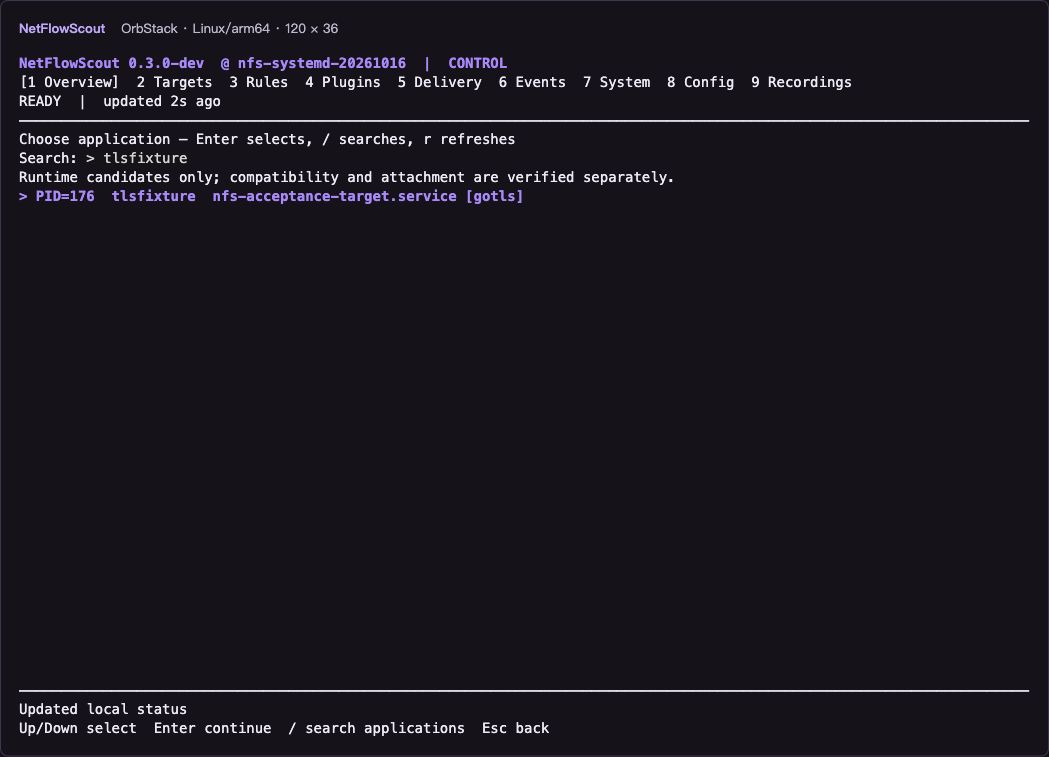
Press n to begin the continuous task, / to search, arrows to select, and Enter to continue. The list contains runtime candidates; compatibility, scope matching and attachment are verified separately. No PID copying is needed.
Create a strategy: start with required fields
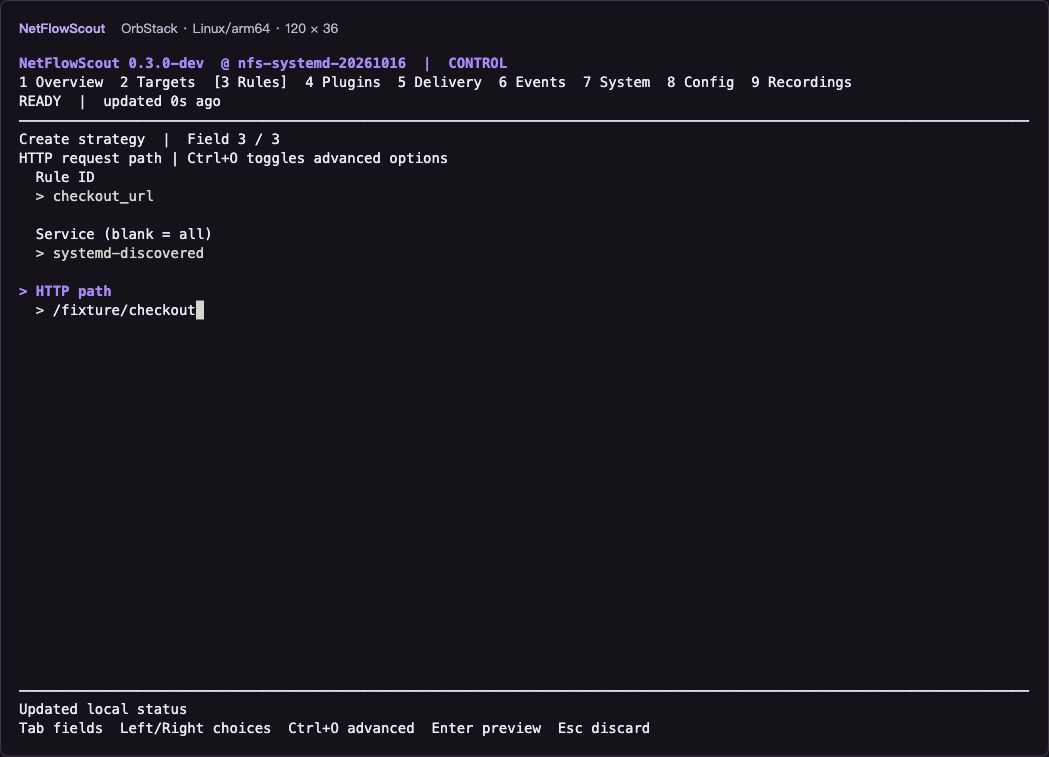
The basic HTTP form contains only the rule ID, service and path. Use Ctrl+O for advanced options, Enter for preview, and Esc to discard. The pictured checkout_url is an unapplied draft; the next event capture comes from an existing rule, not this draft.
Understand an event: rule and delivery evidence
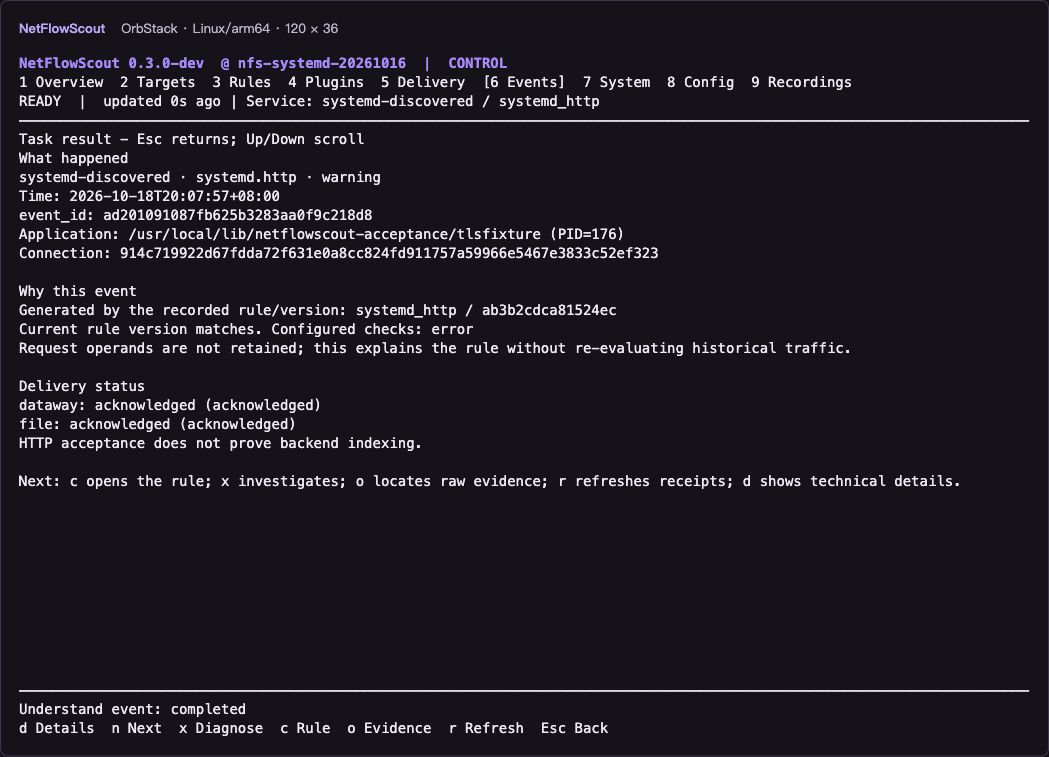
Enter on an event explains what happened, its recorded rule version and each output's receipt. Use d for technical details, x to investigate, and c to locate the rule. This event comes from the active systemd_http rule. A Dataway acknowledgment means HTTP acceptance, not verified backend indexing.
Configuration: edit common settings
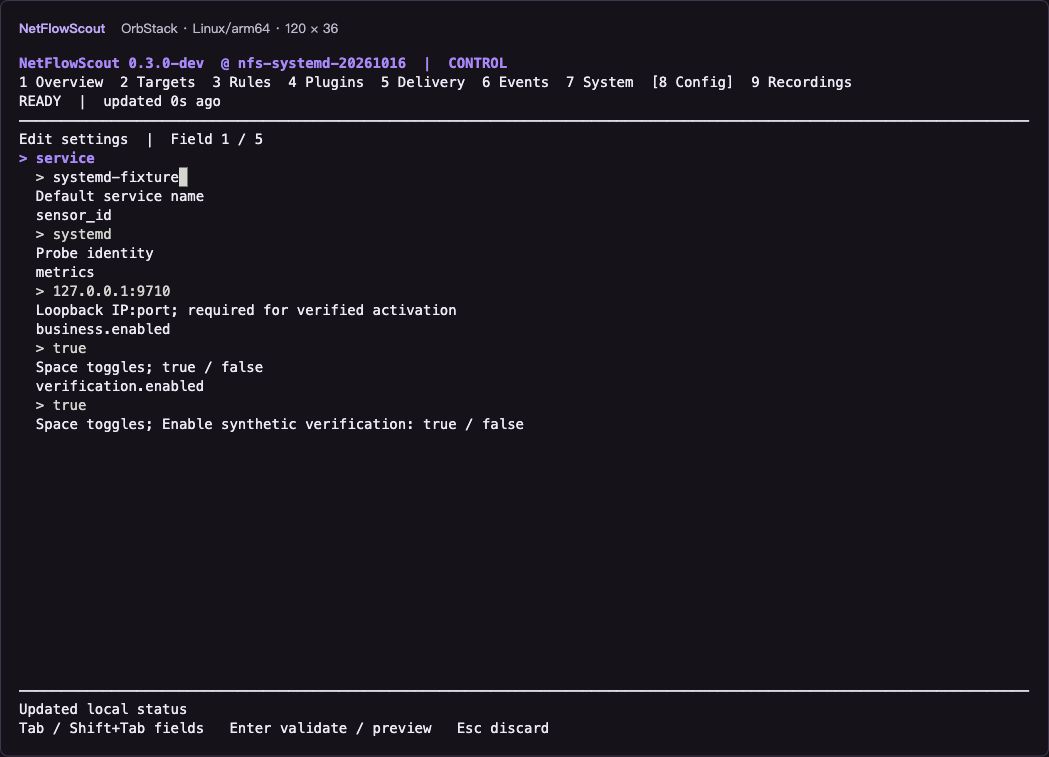
Press 8, select a section, then e for common fields or E for full JSON. Tab/Shift+Tab moves between fields, Enter validates and previews differences, and Esc discards. This shows effective settings in the identity section; opening the form did not save configuration or restart services.
Rule editor: inspect and edit DSL drafts
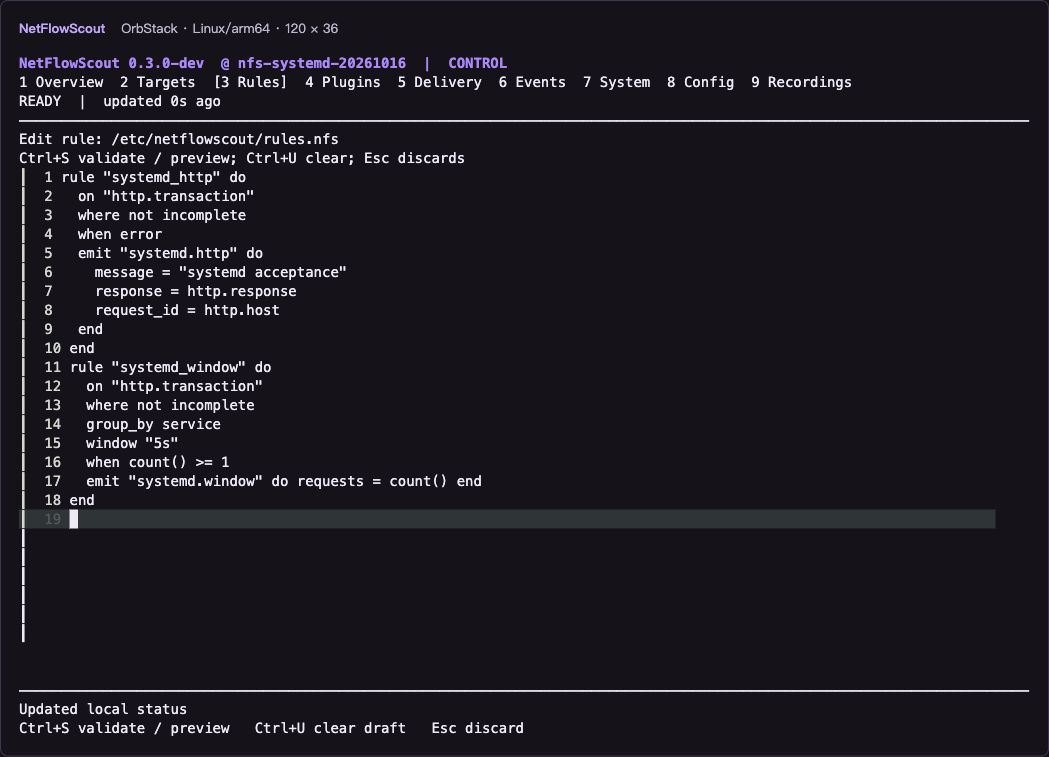
Press 3, select a rule file, and press e to open the editor. Ctrl+S opens application confirmation, Ctrl+U clears the draft, and Esc discards it. This capture only opens existing rules; nothing was saved or reloaded, and no request body is shown. DSL fields and rule IDs retain their spelling in both interface languages.
Plugins: inspect versions and module identity
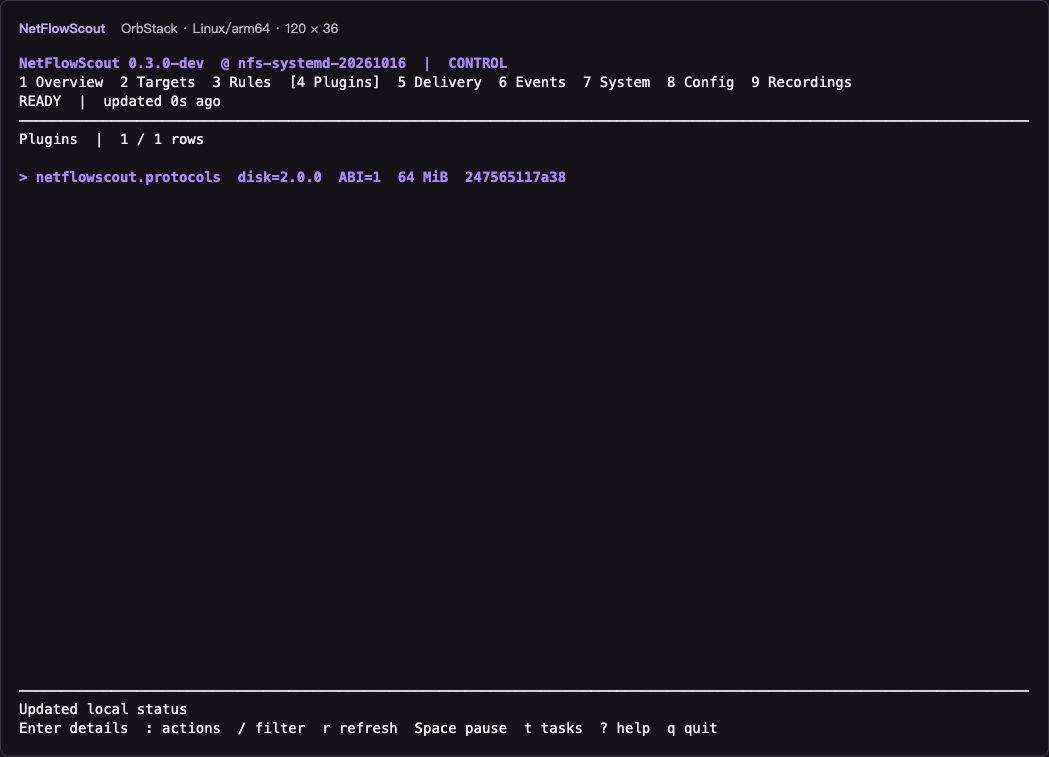
Press 4 to inspect installed versions, ABI, module memory limits and SHA256 prefixes. Enter opens details, then d shows runtime generations. Press : for verification, replay, install/reload and rollback actions. The pictured 64 MiB is the module memory limit, not current RSS. No plugin was installed, reloaded or rolled back during this capture.
Pages
| Key | Page | Purpose |
|---|---|---|
| 1 | Overview | Separate process, coverage, business, delivery evidence, and findings |
| 2 | Targets | Services, process generations, attachments, recent plaintext |
| 3 | Rules | File/runtime versions, editing, testing, reload, restore |
| 4 | Plugins | Hashes, ABI, generations, verification, install, reload, rollback |
| 5 | Delivery | Per-sink pending counts, retries, oldest event time, WAL |
| 6 | Events | Bounded local event tail and incident metadata |
| 7 | System | systemd units, service control, doctor/verify |
| 8 | Config | Main/endpoint forms, JSON, diffs, apply, restore |
| 9 | Recordings | Capture episodes, completeness, replay, export, and protection |
Keyboard
Use 1–9 or Tab/Shift+Tab for pages, arrows or j/k for selection, Enter for details, Esc to return, / to filter, r to refresh, Space to pause polling, : for actions, t for recent tasks, ? for help, and q / Ctrl+C to exit. PageUp/PageDown scroll long results.
On Config, e edits common fields and E edits full JSON. Enter in a form or Ctrl+S in the editor opens a diff preview; y confirms and n/Esc returns to the draft. Use --lang zh|en or L to switch labels; Chinese content and NO_COLOR are supported, and the minimum terminal is 60×14.
Configuration changes
The TUI validates the full configuration/plugin/rule set and wiring, previews diffs and restart impact, checks for concurrent edits, saves .tui-backup, and atomically replaces files with ownership and permissions preserved. Activation coordinates selected services; failure attempts restoration and reports whether it succeeded.
Chain control requires all active endpoint configurations to be selected. Restart causes capture gaps. Changing the WAL path or disabling an existing sink requires offline migration and is refused by the TUI. Actual Dataway tokens remain in EnvironmentFile.
Control auditing defaults to /var/lib/netflowscout/tui-audit.ndjson. Intent is fsynced before mutation; an unwritable audit rejects changes. Audits contain no bodies or credentials. Each session runs one task at a time; exit waits for cleanup.
Interpret status
STALE / UNKNOWN can retain an old snapshot and do not mean current health. Zero targets means waiting. Zero business or no confirmed output cannot establish end-to-end success. Dataway ACK means HTTP acceptance only. Use verification for complete evidence.
Raw evidence and policy settings
Page 9, Recordings, groups rotations by episode and shows completeness/protection. Page 6, Events, locates, dry-runs, or exports a selected event's evidence. Export/protection reuse control confirmation and audit; replay shows redacted results without delivery. Active files cannot be exported. See recording for commands and retention boundaries.
Config adds recording forms and one form per existing endpoint policy for priority, exclusion, service, runtime, protocol, role, and process matching. Single-target configurations get a match form. A blank UID removes that restriction. Use the add/duplicate/remove and scope preview actions for policies; complex connection routes still use JSON drafts. Only changed fields are patched; other policies remain intact.
Use --lang zh|en or L to switch the interface. New strategy, application/policy, diagnosis and bounded rotated-event workflows are described in Setup & investigation. Stable IDs, structured results and underlying diagnostics retain their original spelling.
Use n to continue application selection → strategy → scoped events, C to clear context, and d for technical details. Application selection is a searchable list; strategy forms show only relevant fields, with Ctrl+O advanced options, Ctrl+T templates and Left/Right enum choices. Read-only queries run immediately; changes and synthetic verification still require confirmation. Events open with a readable explanation and links to rules, diagnosis and evidence. See the continuous workflow.