Traffic analysis and detection for Linux
From traffic, Understand HTTP, database and messaging traffic. Detect what matters with your own rules, then send traceable events to a file or Dataway.
Go service · Wasm plugins · Passive network and endpoint captureDownload Linux/arm64 builds →
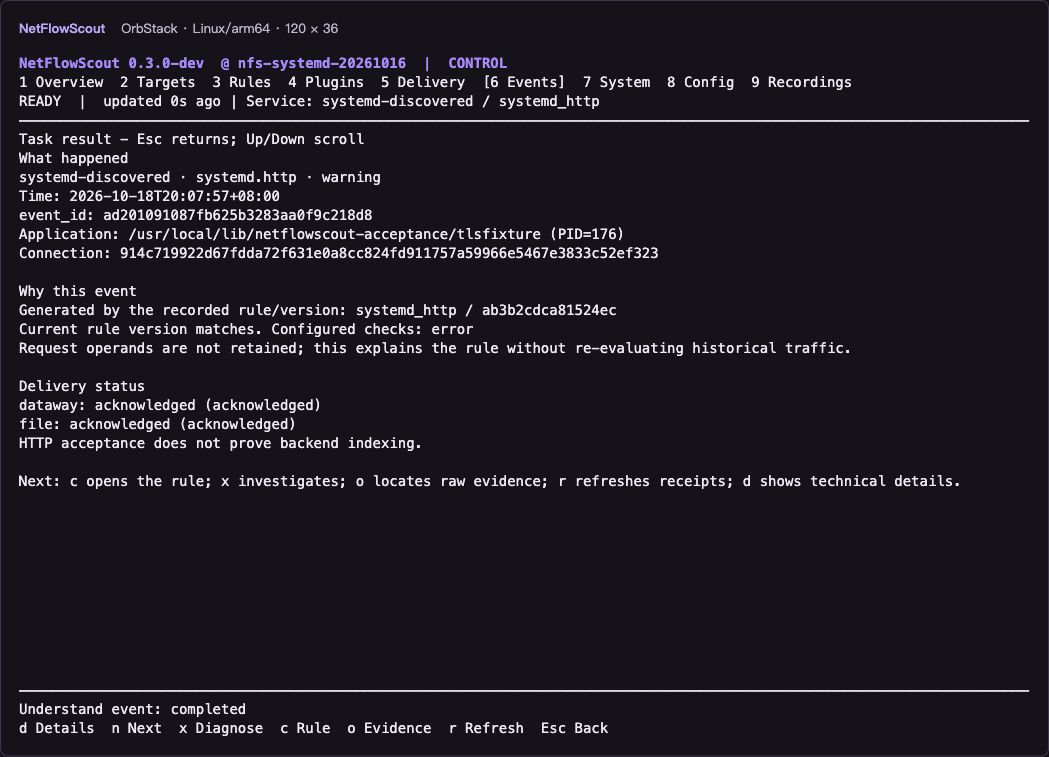
Understand why an event happened Actual OrbStack capture, not live dataView the full screen ↗ Explore capabilities ↓ Choose a starting point ↓ From app to event ↓ Connect capture, analysis and delivery. Scope collection, parse protocols, apply detection rules, then keep the evidence needed to investigate and verify delivery.
Attribute traffic to an application Collect from interfaces, PCAP or supported endpoint plaintext. Endpoint collection discovers processes, reattaches after application restarts, and associates services and connections. Detect business behavior Match URLs, methods, statuses and latency, or calculate error rates over windows. Preview with replay, apply cooldowns and trace rule versions. Extend protocols with Go or Rust Build Wasm plugins with the SDK and TCP / UDP templates. Validate and replay before installing, with bounded resources and plugin reloads. Redact events and retain evidence Events are redacted by default. Explicitly enable local PCAP / endpoint plaintext retention by protocol, service or detection event. Verify each destination separately At-least-once delivery starts after an event commits to the local WAL. NDJSON files and Dataway acknowledge independently, with backoff retries. TLS plaintext requires a compatible endpoint probe. HTTP/3 covers supported quic-go applications only. Check requirements and support limits →
Choose your starting point. Already have the CLI? Verify events with a sample. Deploying for the first time? Start with installation and the configuration wizard.
Try an offline sample For users with the Linux CLI installed. No root, capture permissions or running application required.
Download three synthetic sample files into a separate nfs-demo workspace.Validate the configuration, replay, and inspect local redacted events. sh netflowscout check --config examples/netflowscout.json netflowscout replay --config examples/netflowscout.json \ --input examples/observations.ndjson Expected result On the first run in a fresh directory, 3 observations produce 2 http.server_error events. Response content is [REDACTED].
Get the samples and run the full demo → Deploy on Linux for the first time Choose a version on the download page, get the Linux/arm64 full package, then verify and install it. The latest build is a development preview; historical builds remain available.
Download and verify the full package , including the CLI and protocol plugins.Run the installation wizard to select an application or interface and configure capture and outputs. Run after installation:
sh sudo netflowscout init --lang en Next Preview and confirm the configuration, follow the setup flow to start services, then verify real requests and each destination's receipt.
Download NetFlowScout packages → Already configured? Verify your setup → Choose an app. Write a rule. Understand the event. You define the behavior to detect. Dry-run before activation, then inspect the trigger and delivery status.
Continue with your task. Check the wiring, extend a protocol, or keep the original evidence behind an event.
Protocols that follow your applications. Use plugin init to create a Go / Rust project with TCP / UDP templates, fixtures and expected output. Compile and replay before installing and reloading.
Build your first protocol plugin →